Prime
Lab 2: Analog Circuitry and FFTs
Teams
Team 1: (acoustic) Natan, Siming, and Marcela
Team 2: (optical) Michael and Zoe
Objectives
- Learn how to make analog circuits and digital filter to interface with Arduino
- Use a microphone to detect whistle blow
- Use additional sensor to capture inputs from an IR hat
Optical Team
Michael Xiao and Zoe Du
Materials used:
- breadboard
- wires
- phototransistor (OP598A)
- resistors
- capacitors
- LM358 Op Amp
- Arduino Uno
- IR Hat (6.08 kHz)
- IR decoy (18 kHz)
Goals
The goals for the optical team were to capture input from an IR sensor to detect nearby robots emitting IR signals at 6.08 kHz, while distinguishing them from decoys emitting IR signals at 18 kHz.
Hardware
A phototransistor will let more current pass as it receives more light. As a result, we can make a voltage divider to create an analog output, as seen in the diagram below.

We then attached the Vout signal to the Arduino A0 pin through a 300 ohm resistor to prevent damage to the pin. We shined our IR hat at the phototransistor and received the following waveform on the oscilliscope:

Note that the frequency of the signal is a bit higher than the nominal 6.08 kHz at 6.263 kHz. Also the peak to peak voltage is skewed because we used a different scale factor on our scope cable.
FFT
To analyze the data captured from the IR and capture the frequency, we utilized a fast fourier transform (FFT) on the Arduino. This required a new library from Open Music Labs. We utilized the Analog to digital converter (ADC) rather than using the analogRead command because it runs faster and performs better.
An FFT is a quick way to convert data from the time domain to the frequency domain. The example fft_adc_serial script provided a great starting point as it output data into the serial that we could read and analyze. The first step we took was finding the bin size of the output data. The bin size is the size of each step on the frequency scale outputted by the Arduino. We tested this by using the known 18 kHz signal and looking at the output data. The peak was at bin number 121, meaning that the bin size is approximately 18000/121 = 148 Hz. This means that we should expect to see the 6.08 kHz signal at around bin number 42.
We then took data measurements for both the 6.08 kHz and the 18 kHz signal as shown in the plot below:

Active Filter
As seen in the FFT, there are a lot of spurious frequencies that can be filtered out in order to make the 6.08 kHz signal more visible. To do this, we implemented an active Chebyshev bandpass filter. To design the filter, we used changpuak.ch and chose to filter between 4 kHz and 8 kHz. The resulting circuit is shown below.


To test our filter, we used a function generator to generate a 18 kHz and 6 kHz sine wave and scoped the amplifier output to compare waveform. As seen in the figure below, the 18 kHz has been significantly reduced and filtered out. We tested the range of the filter using the function generator and found that it did indeed allow the signals with 4 - 8 kHz to pass.

We also used the FFT to serial code to gather FFT data of our signals after the filter.

Amplifier
The main problem with our filter was the fact that it decreased the amplitude of the signal significantly as well. As seen in the picture, a 4 V peak to peak was input with the signal generator but only a 1.44 V output was received. When we are trying to sense with the IR phototransistor, some of these signals can be as small as 50 mV.

To make the signal easier to detect, we built a noninverting amplifier as shown below with values of R1 = 4.7 kOhm and R2 = 1 kOhm, yielding a gain of 5.7. We tested our amplifier with the signal generator as well and it worked well.
One difficulty we ran into was using the op amp. We found that the 358 model was more effective because it was compatible with the ground and 5V without having to step everything to 2.5 V to create a +2.5V and -2.5V rail for the 353 op amp model.
Here is out implementation of of the filter, amplifier, and the phototransistor hooked up to the Arduino.

Distinguishing signals
We found that the best way to distinguish the 6.08 kHz and 18 kHz signals was through code. We first do a check on the bin corresponding to our 6.08 kHz hat (bin number 43) to see if it is above a certain threshold. Then we do a check on the 18 kHz FFT to see if bin number 160 is greater than bin number 43. If this is the case, an LED is lit up connected to pin 2.
Code
#define LOG_OUT 1 // use the log output function
#define FFT_N 256 // set to 256 point fft

#include <FFT.h> // include the library

void setup() {
  Serial.begin(115200); // use the serial port
  TIMSK0 = 0; // turn off timer0 for lower jitter
  ADCSRA = 0xe5; // set the adc to free running mode
  ADMUX = 0x40; // use adc0
  DIDR0 = 0x01; // turn off the digital input for adc0
  pinMode(2, OUTPUT);
}

void loop() {
  while(1) { // reduces jitter
    cli();  // UDRE interrupt slows this way down on arduino1.0
    for (int i = 0 ; i < 512 ; i += 2) { // save 256 samples
      while(!(ADCSRA & 0x10)); // wait for adc to be ready
      ADCSRA = 0xf5; // restart adc
      byte m = ADCL; // fetch adc data
      byte j = ADCH;
      int k = (j << 8) | m; // form into an int
      k -= 0x0200; // form into a signed int
      k <<= 6; // form into a 16b signed int
      fft_input[i] = k; // put real data into even bins
      fft_input[i+1] = 0; // set odd bins to 0
    }
    fft_window(); // window the data for better frequency response
    fft_reorder(); // reorder the data before doing the fft
    fft_run(); // process the data in the fft
    fft_mag_log(); // take the output of the fft
    sei();
    if (fft_log_out[86]>30 && fft_log_out[86]<fft_log_out[320]){
      digitalWrite(2, HIGH);
    }else{
      digitalWrite(2, LOW);
    }
  }
}
Video
As seen from the video, the red LED only lights up when exposed to the 6.08 kHz light. The 18 kHz does not trigger the light.
Acoustic Team
Marcela, Natan, & Siming
Materials Used
- breadboard
- wires
- Arduino
- Electret microphone
- 1 uF capacitor
- 300 Ohm resistor
- 3 kOhm resistor
Goals
The goal of the Acoustic team was to use a microphone to detect a 660 Hz sound. This sound signals the robot to start in the competition.
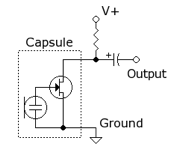
Microphone circuit
The basic circuit for the Electret microphone was created using an additional 3 kOhm resistor and 1 uF capacitor. The circuit is shown as follows.
Amplifier
The first thing we noticed on the scope was how small the signal was. We decided to create an amplifier to increase the amplitude of the signal such that we could get a better reading. Following Team Alpha’s schematic from last year, we created a working amplifier. The main change we made was our choice of Op Amp. We chose to use the LM358 model because of its compatibility with the 5V and ground rails.

After constructing an amplifier, we generated a 660 Hz tone usingg our phone and measured the output using an osilliscope. The waveform is shown below and has a frequency of about 660 Hz.

Here is our circuitry:

FFT
As mentioned in the optical section, we also made use off the FFT library. Using the example code fft_adc_serial, we were able to use our phone to generate a 660 Hz sound and measure it using serial output. The main problem we encountered was that we were reading our 660 Hz sound in bin 5 with the previous code, as the bin size was around 150. To make our FFT more detailed, we decided it would be easier to detect if we lowered the sampling frequency.
This was done by using analogRead() to build our fft input table rather than the ADC. The result of this was a FFT with a smaller range, perfect for our 660 Hz signal. Rather than showing up in the 5th bin, our signal now showed up in bin 49. The resulting FFT is shown below. To compare to other signals , we used an additional 1320 Hz sound to compare on the FFT. As seen in the FFT, the 660 Hz sound was captured in bin 49 while the 1320 Hz sound was captured in bin 57.

Testing
To test, we used a similar techhnique to the optical team and attached an LED to a digital output pin. When bin number 49 was over a certain threshold, this LED lights up signalling that a 660 kHz sound was detected. We tested this using our tone generator with the noise in the lab to calibrate the threshold to a reasonable level. We also tested sounds of other frequencies to see if they triggered the light and our design seemed robust enough for now.
Override Button
In the case that our circuit does not work, we also implemented a last resort to manually start the robot. This was done with a simple switch and setting a digital pin to INPUT. In our video, the button also turns on the LED in addition to the sound.
Code
#define LOG_OUT 1 // use the log output function
#define FFT_N 256 // set to 256 point fft

#include <FFT.h> // include the library

void setup() {
  Serial.begin(115200); // use the serial port
  pinMode(13, INPUT);
  pinMode(3, OUTPUT);


}

void loop() {
  while(1) {
    cli();
    for (int i = 0 ; i < 512 ; i += 2) { //read from microphone
      fft_input[i] = analogRead(A2);  // use analogRead to lower sampling frequency
      fft_input[i+1] = 0;
    }
    fft_window();
    fft_reorder();
    fft_run();
    fft_mag_log();
    sei();

    if (fft_log_out[20] > 40 || digitalRead(13) == HIGH){ //threshold on microphone or manual start
      digitalWrite(3, HIGH);
    } else {
      digitalWrite(3, LOW);
    }
  }
}
Video
Merging our systems
When we merged our systems, one thing we had trouble with was doing two separate types of reads, both with the ADC and analogRead(). For us, the analogRead() technique used by the acoustic team was easier to understand, despite having a lower sampling frequency. To recalibrate our optical system, we did another FFt using the serial output to measure where the peaks were using the 6.08 kHz light. The FFT is shown below:

As seen in the FFT, the 6.08 kHz had peaks near the 77th bin, most likely reesonant frequencies from the input. Using this knowledge, we did two analogRead generated FFTs in our software, one for acoustic and one for optical.
After getting both of our systems working, we connected our breadboards together and modified our code to use different analog and digital pins. Our setup is shown below. When a 660 kHz sound is played, the red LED lights up and when a 6.08 kHz IR light is detected, the yellow LED lights up.

Code
#define LOG_OUT 1 // use the log output function
#define FFT_N 256 // set to 256 point fft

#include <FFT.h> // include the library

int robot = 0;   //another robot detected
int start = 0;   //robot ready to go

void setup() {
  Serial.begin(115200); // use the serial port
  pinMode(13, INPUT);
  pinMode(3, OUTPUT);
  pinMode(7, OUTPUT);

}

void loop() {
  while(1) {
    acoustic();

    if (start ==1){ //turn on light when robot is ready to go
      digitalWrite(3, HIGH);
    } else {
      digitalWrite(3, LOW);
    }

    optical();

    if (robot ==1){ //another robot detected
      digitalWrite(7, HIGH);
    } else {
      digitalWrite(7, LOW);
    }
  }
}

void acoustic(){
  cli();
    for (int i = 0 ; i < 512 ; i += 2) { //read from microphone
      fft_input[i] = analogRead(A2);  // use analogRead to lower sampling frequency
      fft_input[i+1] = 0;
    }
    fft_window();
    fft_reorder();
    fft_run();
    fft_mag_log();
    sei();

    if (fft_log_out[20] > 40 || digitalRead(13) == HIGH){ //threshold on microphone or manual start
      start = 1;
    } else {
      start = 0;
    }
}

void optical(){
  cli();
    for (int i = 0 ; i < 512 ; i += 2) { //read from IR
      fft_input[i] = analogRead(A0);  // use analogRead to lower sampling frequency
      fft_input[i+1] = 0;
    }
    fft_window();
    fft_reorder();
    fft_run();
    fft_mag_log();
    sei();

    if (fft_log_out[154 ] > 20){ //threshold on IR sesnsor
      robot = 1;
    } else {
      robot = 0;
    }
}